Cargo E-Bike vs Van vs E-Moped: Real TCO for Urban Delivery Fleets (2026)
 Share on X
 LinkedIn
 Facebook
 Reddit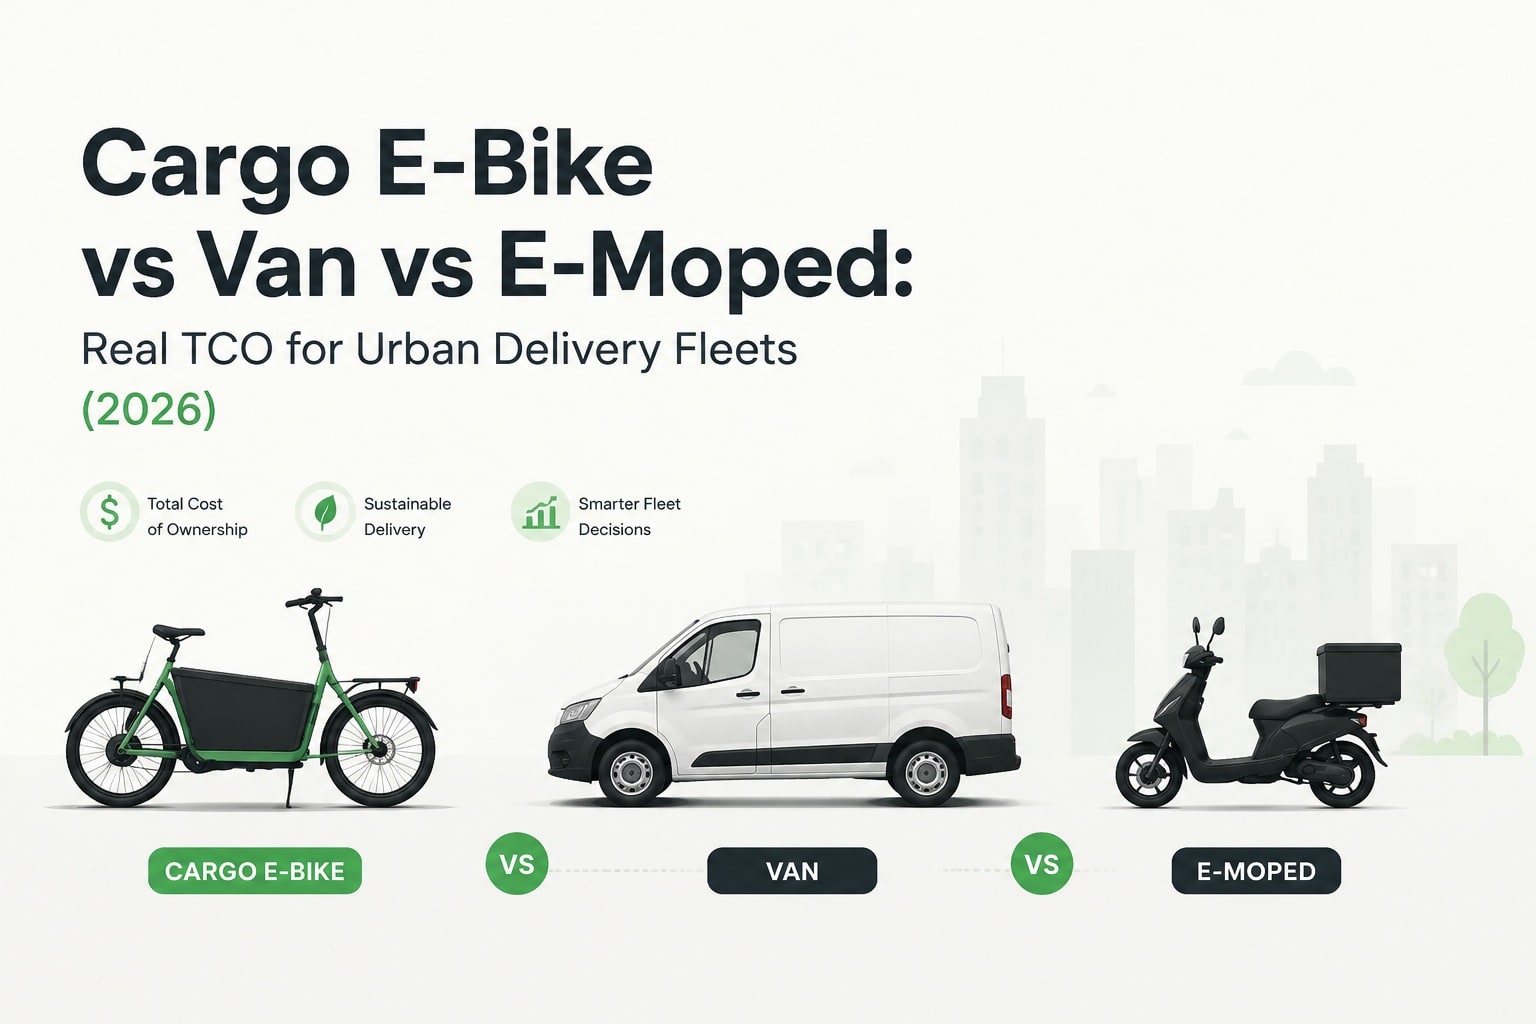
Most fleet RFQs still start with the wrong question: “What does the bike cost?” The better question is: what does one delivered stop cost over three to five years?
Purchase price is only one line. Energy, insurance, parking, congestion and zero-emission zone fees, maintenance downtime, rider or driver wages, and residual value often decide the winner long before the CapEx spreadsheet looks finished.
This guide builds a transparent total cost of ownership (TCO) model for three common urban last-mile platforms—cargo e-bike, e-moped / light scooter, and small delivery van—then shows when each platform wins. It is written for fleet operators, 3PLs, quick-commerce teams, and importers who need a decision frame before they open a quote.
How to read this model
Figures are illustrative planning ranges in EUR for a dense European city in 2026 (adjust for US, LatAm, Middle East, or SEA with local fuel, insurance, and labor). They are not TXED list prices and not a formal quote. Use them to stress-test your own numbers, then re-run the table with local quotes, duty cycle, and wage rates.
The Baseline Scenario: 50 Vehicles, Dense Urban Core
To keep comparisons honest, we lock one operating profile and change only the vehicle class:
- Fleet size: 50 active units (plus a small spares buffer where noted)
- Duty: mixed food + small parcel last-mile in a dense city core
- Shift: 1.5 shifts/day average (peak lunch + evening coverage)
- Stops: 45–70 drops per vehicle-day depending on platform speed and access
- Average payload: 15–40 kg per stop cluster; multi-stop staging from a micro-hub
- Daily distance: 35–55 km per vehicle for two-wheel platforms; 50–80 km for vans covering a wider catchment
- Horizon: 3-year operating plan and 5-year asset life for residual value
If your average stop is a pallet, your catchment is suburban, or your routes regularly exceed 100 km/day, vans will look better than this model. If your core is a zero-emission zone with bike lanes and sub-5 km hops, cargo e-bikes usually pull ahead faster than CapEx alone suggests.
What Belongs in a Real Delivery TCO
Ignore any comparison that only shows sticker price. A usable fleet model needs at least these buckets:
| Cost bucket | Why it matters | Often missed? |
|---|---|---|
| Acquisition / lease | Purchase, finance, or operating lease; cargo box and mounts included | Box, rack, and branding often added late |
| Energy | kWh or fuel per productive km under load | Cold weather and hills inflate real draw |
| Insurance & compliance | Third-party liability, theft, registration, category licensing | Mopeds/vans jump categories fast |
| Parking, access & city fees | Depot rent, curb parking, congestion, ULEZ/ZEZ, fines | Biggest silent van cost in city cores |
| Maintenance & consumables | Brakes, tires, chains/belts, batteries, service labor | Downtime cost often exceeds parts |
| Labor | Courier vs driver wage, training, license requirements | Usually the largest absolute cost |
| Productivity & residual | Stops/hour, rework, residual value at exit | Access rights beat top speed in dense cores |
Unit Economics Snapshot (Per Vehicle, Annualized)
Below is a planning-range snapshot for one vehicle-year under the baseline scenario. Labor is shown separately because wage bands dominate every platform and vary more by city than by vehicle.
| Line item (indicative € / vehicle-year) | Cargo e-bike | E-moped | Small van |
|---|---|---|---|
| CapEx amortized (4–5 yr life) or lease equivalent | €700–1,400 | €600–1,300 | €3,500–7,000 |
| Energy (electricity / fuel) | €60–180 | €120–280 | €1,200–3,200 |
| Insurance + registration / category fees | €40–180 | €250–700 | €800–1,800 |
| Parking, congestion, ZEZ / access fees | €0–150 | €100–500 | €1,500–5,000+ |
| Maintenance, tires, consumables, battery reserve | €250–550 | €350–700 | €900–2,000 |
| Non-labor operating subtotal | ≈ €1,050–2,460 | ≈ €1,420–3,480 | ≈ €7,900–18,999 |
| Labor (courier / driver fully loaded) | €28,000–42,000 | €28,000–42,000 | €32,000–48,000 |
Read the table carefully: cargo e-bikes rarely win because they are “cheap toys.” They win because they collapse energy, insurance, parking, and access cost while keeping labor in a courier band and often raising stops per hour inside bike-priority streets and pedestrian cores.
3-Year and 5-Year Fleet View (50 Units)
Scaling the mid-range non-labor subtotal and adding a modest spares buffer (≈6% for two-wheel fleets, ≈4% for vans) produces this planning envelope. Labor is excluded so platform differences stay visible; add your local wage sheet on top.
| Planning total (non-labor) | Cargo e-bike fleet | E-moped fleet | Small van fleet |
|---|---|---|---|
| 3-year fleet envelope | ≈ €170k–€390k | ≈ €230k–€555k | ≈ €1.2M–€3.0M |
| 5-year fleet envelope | ≈ €280k–€650k | ≈ €380k–€920k | ≈ €2.0M–€5.0M |
| Typical residual after 5 years | Low–moderate; batteries may be mid-life replaced | Low–moderate | Higher absolute residual, but still large depreciated base |
Rule of thumb
In dense cores with ZEZ pressure, cargo e-bike non-labor TCO often lands at roughly one-fifth to one-third of a small van over three years—before counting parking tickets, loading-bay delays, or diesel surcharge volatility. E-mopeds sit in the middle: cheaper access than vans, more compliance friction than EPACs.
Cost Drivers That Actually Move the Needle
1. Access beats top speed
A van that averages 18 km/h door-to-door in congestion can lose to a cargo e-bike averaging 15–18 km/h on bike infrastructure with zero loading-bay hunt. The KPI is stops per paid labor hour, not peak motor speed.
2. Category risk is a cash cost
Push a delivery bike into the wrong power/throttle class and you inherit moped or L-category insurance, plates, and rider licensing. That is why market-legal motor limits matter as much as torque. See our country map: Delivery E-Bike Motor Power Limits by Country.
3. Battery strategy is OPEX, not a gadget
A dual-pack or swap workflow that keeps riders on-shift for lunch and dinner peaks can raise daily stops more than a 2 kW motor ever will. Undersized single packs create hidden “mid-shift dead time” that never appears on the purchase order.
4. Downtime multiplies everything
One van off the road removes a large daily capacity block. One cargo bike offline is easier to cover with a spare from a 50-unit pool—if you budget spares and parts lead time. Cheap frames with frequent spoke, brake, or rack failures erase CapEx savings in months, not years.
When Cargo E-Bikes Win
- Urban cores, historic centers, campuses, and pedestrian-priority districts
- Average hop distance short to medium; multi-stop density high
- Payload mostly under ~80–100 kg staged loads (or up to ~150 kg on trikes for neighborhood runs)
- Zero-emission zones, congestion charging, or scarce curb space
- Brand or ESG targets that penalize ICE last-mile
- Food delivery, pharmacy, small parcel, reverse logistics, and micro-hub injection routes
When E-Mopeds Still Make Sense
- Longer urban–suburban hops where bike lanes thin out
- Rider preference / local labor market already moped-trained
- Light payloads but higher average speed needed between sparse stops
- Markets where light motorcycle category is cheap to insure and park
Watch the trap: if local rules, helmet laws, age limits, or parking bans tighten, moped TCO can jump overnight while EPAC cargo bikes stay in the bicycle cost band.
When Vans Still Win
- Bulky or heavy multi-drop loads beyond cargo-bike volume (white goods, bulk grocery totes, B2B wholesale)
- Long suburban or inter-district trunking before a bike micro-hub handoff
- Weather or security constraints that demand enclosed, lockable volume all day
- Labor models built around licensed drivers and existing van depots
- Very low stop density where access advantages never pay back
The highest-ROI networks are often hybrid: vans or light trucks feed micro-hubs; cargo e-bikes own the final 1–3 km. That design captures van trunk efficiency without paying van costs on every doorstep.
Cost-per-Stop: The Metric Procurement Should Own
Convert platform choice into one shared KPI:
Cost per stop ≈ (non-labor vehicle cost + labor + allocated depot) ÷ completed stops
Illustrative dense-core outcome under the baseline (order-of-magnitude, not a guarantee):
- Cargo e-bike: often the lowest cost/stop when bike infrastructure and ZEZ rules favor two wheels
- E-moped: competitive on longer thin routes; loses when registration and parking stack up
- Van: can win on bulk density or long thin routes; frequently loses on pure door-density in charged city cores
Run the formula with your stops/hour from a two-week pilot. Spreadsheet assumptions without timed routes are how fleets buy the wrong class at scale.
Map the Economics to TXED Cargo Platforms
Once TCO says “two-wheel cargo,” match architecture to duty cycle—not the other way around. A practical mapping:
| Duty profile | TCO priority | TXED starting point |
|---|---|---|
| EU food / light parcel, legal EPAC band | Compliance simplicity + low insurance | TXED EU Courier 27.5" · 25 km/h (250W) |
| High drops/day, long city loops | Energy + swap time, range headroom | TXED Long Range Cargo 20" · 1440Wh or Dual Battery City 20" |
| Heavier staged loads, mixed terrain | Payload durability, fewer failed climbs | TXED Fat Tire Cargo 20" · 750W option (where legally allowed) |
| Bulky grocery / neighborhood commercial | Volume stability over speed | TXED E Cargo TR02 20" · 3-Wheel |
| Mixed cargo + occasional passenger assist | Versatility, rider comfort on long shifts | TXED Cargo + Passenger 24" longtail platform |
For the full spec-matching workflow (payload, range, terrain, compliance), use the companion guide: How to Choose the Right Delivery E-Bike for Your Fleet. For scenario design beyond pure TCO, see 5 Real-World Cargo E-Bike Use Cases.
A 10-Line TCO Worksheet You Can Copy
Before you request quotes, fill one row per candidate vehicle:
- Purchase or monthly lease (include box, locks, branding)
- Expected residual after 36 / 60 months
- kWh or fuel per productive day × local tariff
- Insurance + registration + rider license overhead
- Parking / congestion / ZEZ / anticipated fines
- Scheduled maintenance + tire/brake budget
- Battery replacement reserve (year 3–5)
- Spares pool % and average days offline
- Labor fully loaded × productive hours
- Measured or piloted stops per hour
If a vendor cannot help you complete lines 3–8 with commercial references, you are buying a brochure, not a fleet asset.
Common TCO Mistakes We Still See in 2026 RFQs
- Comparing van lease payment only to cargo-bike purchase price
- Ignoring curb, depot, and ZEZ costs that only vans trigger
- Speccing peak motor watts instead of legal category + real torque under load
- No pilot: scaling 200 units from a showroom ride
- No spare ratio: 50 bikes with zero buffer looks cheap until Monday peak
- Forgetting mid-life battery economics on high-cycle fleets
- Assuming one global SKU works in EU, UK, US, and Singapore power regimes
Decision Frame: Choose the Network, Then the Vehicle
The strongest 2026 fleets do not ask whether cargo bikes “replace all vans.” They ask:
- Which stops are van-compulsory (bulk, distance, security)?
- Which stops are access-constrained (ZEZ, old town, campus, mall service corridors)?
- Where can a micro-hub cut average hop length below the cargo-bike sweet spot?
- Which legal category keeps insurance and labor simple in each city?
- What pilot KPI (cost/stop, on-time %, downtime hours) gates the scale order?
Answer those five, and the CapEx debate usually collapses into a clear split: vans on the trunk, cargo e-bikes on the doorstep—or cargo-first where the city already prices cars out of the core.
Build Your Numbers with TXED
TXED supplies commercial delivery and cargo e-bike platforms for B2B fleets—from EU-ready 250W courier builds to higher-power and high-payload variants where local rules allow—plus OEM/ODM paths for branded rollouts.
If you are comparing cargo e-bikes against mopeds or vans for a city launch, send us:
- Target cities and legal category constraints
- Average and peak payload, box volume, and daily km
- Shift pattern and whether you need battery swap
- Pilot size now / scale size in 12 months
We will help map a model shortlist and a realistic operating envelope—not just a unit price.
Next step: explore the delivery & cargo e-bike range, or contact the B2B team with your route profile for a configuration and TCO review. For European market context, also read Why Cargo E-Bikes Are the Next Big Trend in European Urban Mobility.